QLD Rents Highlight a Residential Supply Shortage
Queensland weekly rents: LGA movers by property type

Whilst most commentators are focussed on what is happening in the housing market with regard to price, there seems to be little attention paid to the rental market. At a time when supply is sorely needed, those celebrating housing price declines may have missed the point that what we are witnessing at present is more of a tenure shift, than a supply led decline.
International migration is forecast to grow by 260,000 people this year, yet most capital cities are struggling to build apartment product that the average Australian can afford, this will only get worse if the housing market falls. First home buyers represent at best 25% of the market with most new home builds being to second home buyers onwards; many of which don’t have to trade up. If they don’t trade up, supply continues to be constrained and will push rents further. Already our major land developers are seeing the market slow in terms of volumes, this is not a good outcome for supply particularly given that the apartment market can not take up the slack right now. Talks of a property market crash would seem at this point, significantly overstated and possibly short lived when one considers that 260,000 international migrants would have previously started a debate on what a “Big Australia” looks like with these numbers likely to hold the unemployment rate artificially low. With only two years to the next election, expect the Federal Government to step in with a stimulus package.
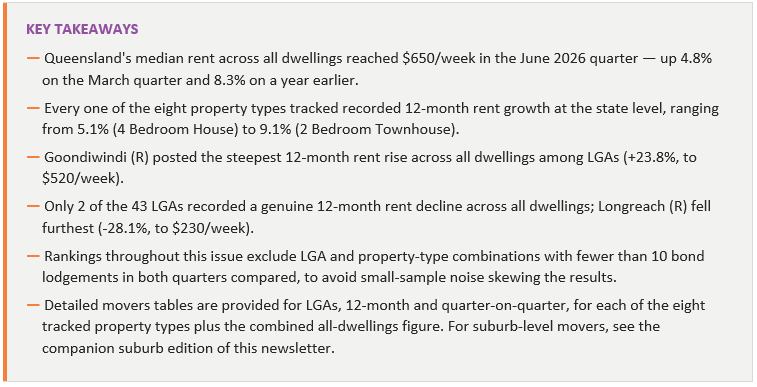
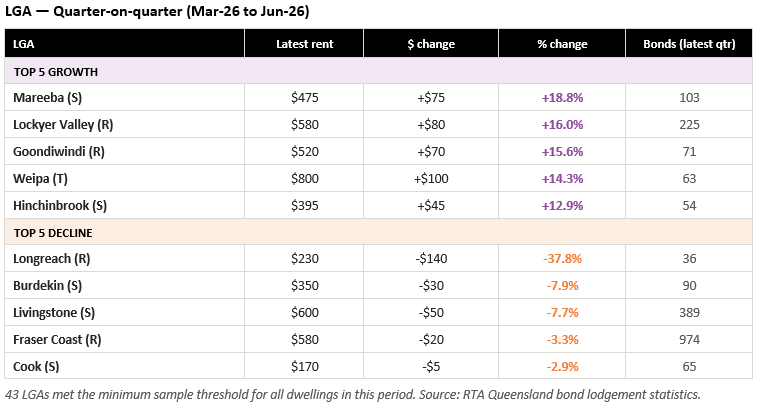
To the point of this article regarding rents and supply indicators, every quarter the Residential Tenancies Authority (RTA) publishes the median weekly rent paid on every new tenancy lodged across Queensland — by Local Government Area (LGA) and by dwelling type. This newsletter uses that full dataset (43 LGAs, nine dwelling categories, back to 2012) to rank Queensland's biggest LGA-level rental movers for the June 2026 quarter, both over the past 12 months and quarter-on-quarter, broken out by property type.
A note on method before the numbers: rents for smaller LGAs can be based on a limited number of bond lodgements, and a couple of unusual leases can swing a "median" without reflecting any real market movement. Every ranking below excludes any LGA and property-type combination with fewer than 10 new bonds lodged in both quarters being compared, so the movers listed here reflect genuine, reasonably-sampled shifts in rent — not statistical noise from a thin market. Unlike the companion suburb edition of this newsletter which will be released this week, LGA tables here show both growth and decline, since LGA is a larger and more stable geography. (Scroll through the graphs to read our final insights and conclusions.)
State of the Queensland rental market
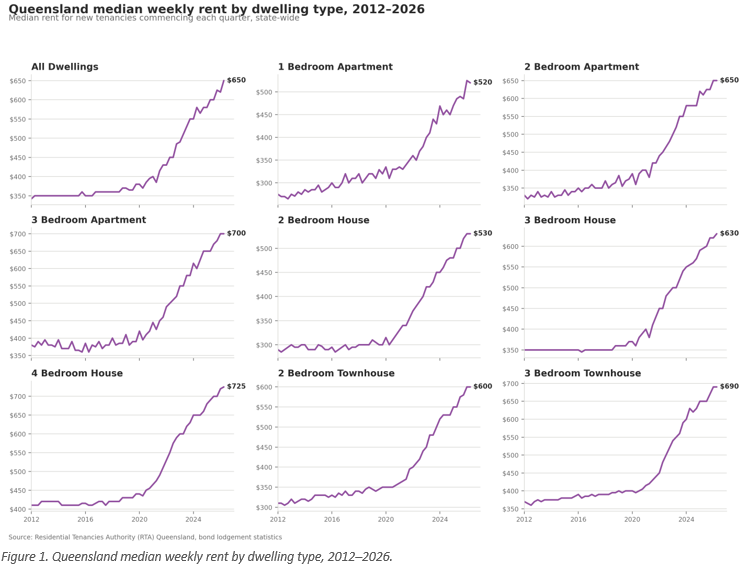
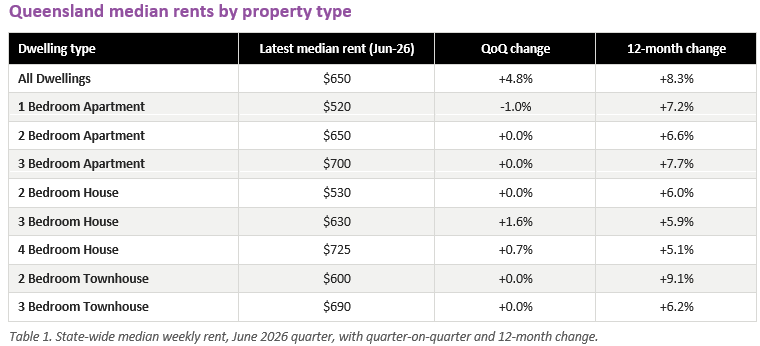
Rent growth has been broad-based across every dwelling type over the past year, though the pace has eased from the sharper increases seen in 2022–23. The chart below tracks the state median for each property category back to 2012 — the acceleration from 2021 onward is visible across every panel, coinciding with Queensland's strongest population growth in a generation and a rental vacancy rate that has remained persistently tight.
Queensland's biggest LGA movers — all dwellings
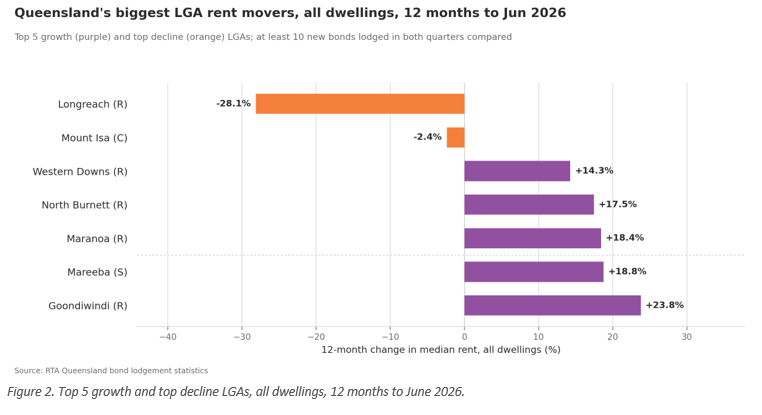
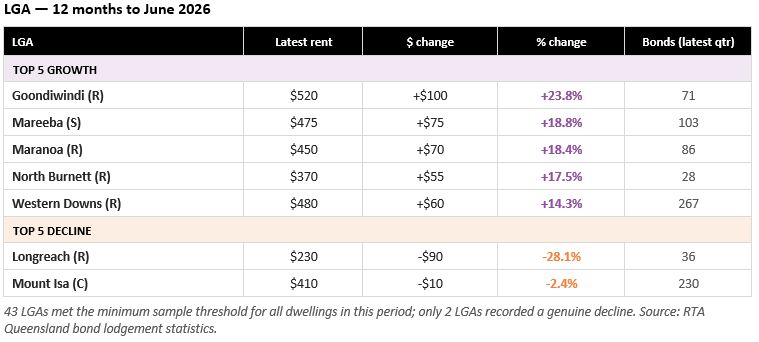
Before breaking movers down by property type, here is the combined "all dwellings" picture — every new tenancy regardless of bedroom count or dwelling style. Because this figure blends whatever mix of properties happened to lease in a given LGA each quarter, a swing here can sometimes reflect a change in which properties leased (e.g. more houses and fewer flats) rather than like-for-like rent growth — the property-type tables in Section 3 isolate that effect. Treat the all-dwellings figures as a useful headline, and the property-type tables as the more reliable read on genuine rent movement.
Conclusion & outlook
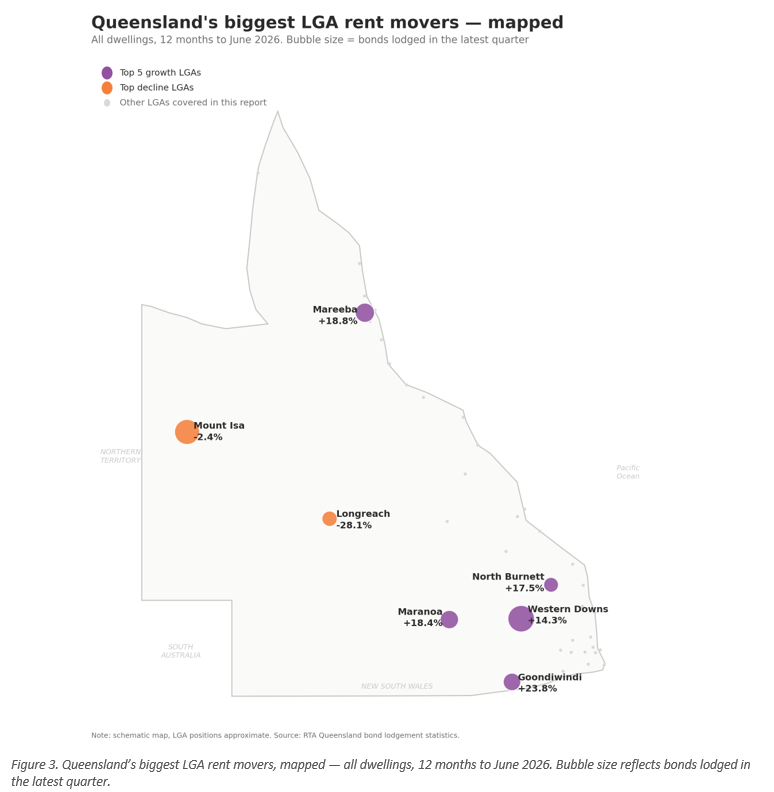
Queensland’s rental market kept climbing through the June 2026 quarter, but the geography of that growth is uneven. Mapped out, the State’s fastest-rising LGAs cluster heavily in the Darling Downs and South West — Goondiwindi, Western Downs, Maranoa and North Burnett all post double-digit 12-month growth — while Mareeba does the same for Far North Queensland. The two genuine declines, Mount Isa and Longreach, sit alone in the outback and the Gulf, geographically and economically distant from the growth corridor. That pattern is worth sitting with before drawing conclusions from percentages alone acknowledging that the future of Mt Isa in its current form is unknown.
Economic backdrop
The growth side of the map lines up with a broader story about where people are moving. Queensland remains the country’s top destination for interstate migration, and regional LGAs are taking an outsized share of it — the Sunshine Coast and Fraser Coast rank among the top destinations nationally for people leaving the capitals, and Toowoomba and Townsville have both seen sharp increases in capital-to-regional relocations over the past year, particularly given the house price differentials. That demand is arriving into a housing stock that is still catching up: Queensland detached house approvals rose 8.6% in 2025–26, a genuine improvement, but the Housing Industry Association continues to describe underlying demand as running ahead of supply, and national housing affordability is at its weakest in three decades. Against that backdrop, a State-wide median rent 8.3% higher than a year ago is consistent with a market where population growth is outpacing new dwellings, rather than a one-quarter anomaly.
Interest rates are, for now, a steadying rather than a moving part. The Reserve Bank has held the cash rate at 4.35% since May 2026 and is broadly expected to stay on hold for the remainder of the year, with rate cuts pushed out to 2027, though it is not impossible to see a 25 basis point drop late in 2026. A stable cash rate removes one source of month-to-month volatility in landlord holding costs, but it also does little to bring first-home buyers off the sidelines while borrowing capacity remains constrained — which keeps pressure on the rental pool rather than releasing it.
The concentration of growth in the Darling Downs and South West carries its own caveat. In late July 2026, drought was declared across Goondiwindi, Southern Downs, Balonne and southern Maranoa following prolonged below-average rainfall — the same LGAs recording some of the steepest rent increases in this issue. It would be a mistake to read that as agricultural prosperity driving rents up; more likely, a thin rental stock (Goondiwindi’s June quarter figure is drawn from just 71 bond lodgements, North Burnett’s from only 28) is being squeezed further by drought-response workers, contractors and support staff moving through the region, which can move a small-sample median sharply on relatively few transactions. The same small-sample caution applies in the other direction: Longreach’s -28.1% follows just 36 bonds and Mount Isa’s -2.4% follows 230, and both readings should be treated as directional rather than precise until confirmed over further quarters.
None of this changes the headline: rents rose in almost every Queensland LGA over the past year, and by a meaningful margin in most of them. But the “where” matters as much as the “how much” — the growth map points to a housing market still absorbing a historic wave of interstate and intrastate migration into a supply pipeline that, even improving, has not caught up, while the handful of outback exceptions are small enough in volume to warrant a wait-and-see read rather than a trend call. We will be watching the Darling Downs and South West corridor most closely next quarter, both for signs the drought-related demand is transitory and for whether rent growth broadens further into the migration-driven regional centres of the South East and Wide Bay.
Matthew Gross | Director | mgross@nprco.com.au
Nicholas Price | Associate Director | nprice@nprco.com.au