Capital City House Price Perspectives

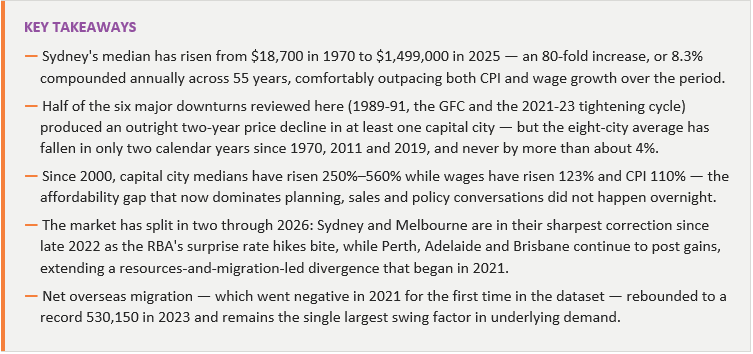
Fifty-five years of data tell a consistent story: Australian house prices climb through almost everything — oil shocks, double-digit interest rates, tech boom and busts, banking collapses, pandemics — and the periods when they don't are shorter and shallower than most people expect. This issue uses the long-run capital city series to line up six recessions and rate cycles against what actually happened to prices in each city, and then looks at where the current cycle — a surprise RBA hiking round through early-to-mid 2026 — sits against that history to provide some possible insights to the current cycle.
Fifty-five years in one chart
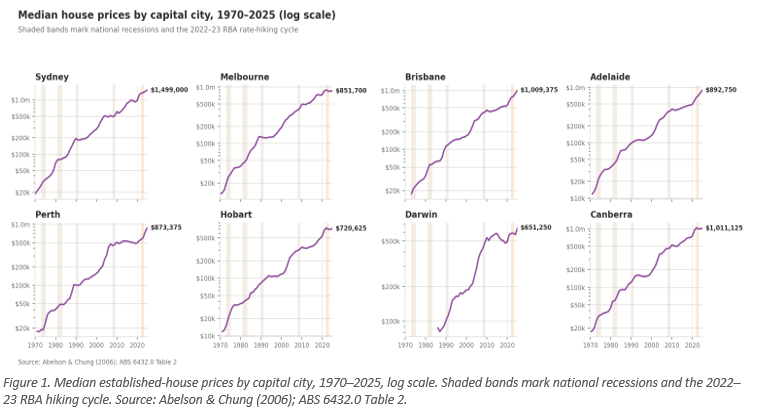
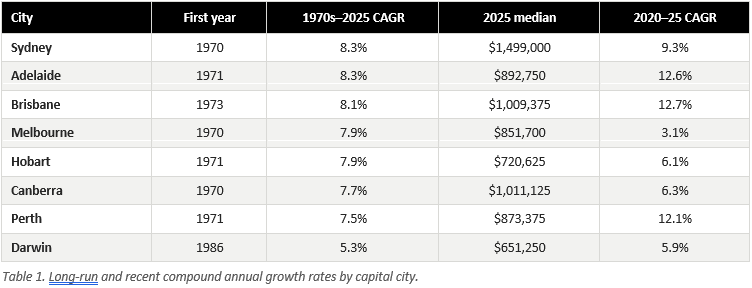
The headline number is the compounding. A Sydney house bought at the 1970 median of $18,700 and held to 2025 would show a price 80 times higher; Adelaide (75x) and Canberra (58x) are not far behind, while Darwin, with a shorter published series starting in 1986, has grown a more modest 7.4 times. Across the seven cities with data back to the early 1970s, compound annual growth clusters tightly between 7.5% and 8.3% — a reminder that despite very different local economies, the long-run growth rate of established-house prices in Australia's capitals has been remarkably uniform.
That uniformity masks real divergence in the shorter term. The small-multiples view below plots each capital on a logarithmic scale, so that a consistent growth rate would appear as a straight line — the visible kinks are where a city's growth rate genuinely changed, not just where the dollar figures got bigger. Sydney's steep 1980s climb, Perth and Darwin's resources-boom acceleration through the 2000s, and the flattening in Melbourne and Canberra since 2022 all stand out clearly on this view.
Whilst often treated as a short term commodity like shares, property is a long term asset which has largely been used to grow individuals wealth, irrespective of whether they were an owner occupier with no capital gains attribution or an investor with occasional changing of the rules.
City comparison at a glance
What recessions do to house prices (and what they don't)
Recessions do slow price growth — but the data shows they rarely reverse it outright, and the cities that fall are usually not the ones you'd guess. The chart below lines up average annual capital city growth against CPI inflation, with recession years and the 2022–23 rate-hiking cycle shaded. The pattern that emerges is less "crash" and more "pause": growth slows sharply, sometimes turns briefly negative in a city or two, and then resumes once rates or inflation ease.
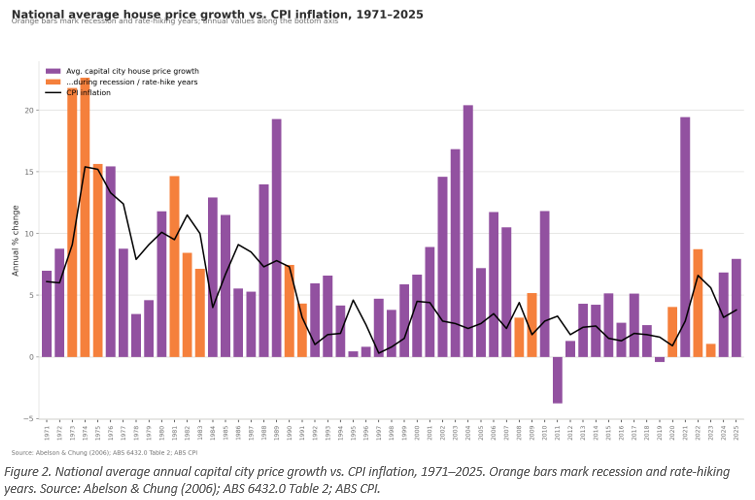
1973–75 — the oil shock and stagflation — The 1973 OPEC oil embargo pushed CPI inflation from 9.1% to a peak of 15.4% by 1974, and the Whitlam government's expansionary policies added to wage-price spirals. Nominal house prices kept climbing regardless — every city in the series posted double-digit growth over the two years, led by Hobart (+70%) and Adelaide (+61%). In an inflationary shock, housing behaved as a store of value rather than a casualty.
1981–83 — recession, drought and a wage breakout — A severe drought, a global downturn and a domestic wages breakout pushed unemployment above 10% and forced the incoming Hawke government into the Prices and Incomes Accord. House prices decelerated sharply but stayed positive everywhere — Sydney managed only +3.2% over the two years, its weakest showing of any event in this review, while Brisbane and Adelaide both grew above 22%.
1989–91 — "the recession we had to have" — This is the closest the data comes to a genuine correction. Mortgage rates above 17% and the collapse of over-leveraged property and finance companies (Pyramid Building Society among them) tipped unemployment to 10.8%, the worst since the Depression. Melbourne (-3.8%) and Perth (-2.9%) recorded outright two-year declines — Victoria's economy and property sector were hit hardest of any state in the dataset — while Sydney, Brisbane, Adelaide and Canberra continued to post gains.
2007–09 — the Global Financial Crisis — Australia avoided a technical recession thanks to fiscal stimulus, aggressive RBA rate cuts and continued Chinese resource demand. Sydney (-0.6%) and Perth (-1.2%) recorded mild two-year declines, but Darwin — still riding resources investment — grew 20.4% over the same window. The GFC is the clearest example in the data of a genuinely two-speed economy: mining states diverging from the rest.
2019–20 — the COVID-19 recession — Australia's first recession in almost 29 years barely dented house prices: every capital posted a gain through 2020, from Perth's modest +1.7% to Hobart's +9.5%, as JobKeeper, mortgage deferrals, HomeBuilder grants and record-low rates cushioned the shock. The real story was what followed in 2021, when national average house price growth hit 19.4% for the year — the fastest pace since the early-2000s mining boom (2004 remains the outright record at 20.4%) and among the four strongest years in the entire 55-year series, alongside 1973, 1974 and 2004 — as ultra-cheap money met closed borders, returning expats and a scramble for space.
2021–23 — the fastest tightening cycle on record — The RBA lifted the cash rate from 0.10% to 4.35% between May 2022 and August 2023, the steepest hiking cycle in its history, cutting average borrowing capacity by roughly $12,000 for every 25-basis-point move. Measured from 2021 (the peak of the pandemic boom) to 2023, price growth slowed but mostly did not reverse — Adelaide (+24.7%) and Brisbane (+19.9%) kept accelerating over that window on the back of interstate migration and tight supply, while Melbourne (-1.1%) was the only capital to record a net two-year decline. The record migration rebound (net overseas migration hit 530,150 in 2023, close to double any prior year in the series) was arguably the larger force offsetting higher rates.
Today's market: the two-speed correction of 2026
Fast-forward to today, and the split we saw during the GFC and the 2022–23 hiking cycle has returned in sharper form. After a brief easing phase — the RBA cut the cash rate from 4.35% to 3.60% between December 2024 and May 2025 — inflation surprised to the upside and the Board hiked three times through February, March and May 2026, taking the cash rate back to 4.35% before pausing in June. Each 25-basis-point move removes roughly $12,000 of borrowing capacity for a typical earner, and this cycle's impact is landing very unevenly across the capitals.
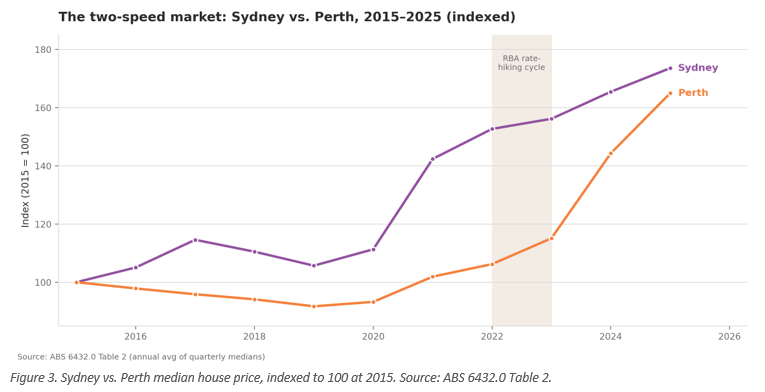
Cotality's Home Value Index fell 0.4% nationally in June 2026 (though we will wait and see where it actually lands when sales price data is released in full), the largest monthly drop since December 2022, with capital city values down 1.3% over the quarter. Sydney (-3.2%) and Melbourne (-2.6%) are driving that number — both markets are now in their sharpest correction since the 2022 hiking cycle. Perth, Adelaide and Brisbane, by contrast, are still recording gains, albeit at a slower pace than 2023–24. Domain's FY27 forecast has Sydney falling a further 3–7% and Melbourne 4–8% which would be extraordinary by historical standards, particularly for Melbourne which must be at or near the bottom of its cycle. A change of Premier may well have a positive impact, though the State might be due for a change in political party. Contrary to this, the three growth capitals of Perth, Brisbane and Adelaide are expected to push on toward record highs. The chart below indexes Sydney and Perth to 100 at 2015 to show just how far the two growth paths have now separated.
Migration, wages and the affordability squeeze
The gap between what incomes can buy and what housing costs is not a new phenomenon — it has been widening steadily for a quarter of a century. Since 2000, the Wage Price Index has compounded to a cumulative 123% increase and CPI to 110%, while capital city medians have risen between 249% (Darwin) and 561% (Adelaide) over the same period — Sydney is up 422%, Melbourne 346%, Brisbane 494% and Perth 459%. Whatever the near-term cycle does, this structural gap between incomes and prices is the backdrop against which every planning, development and sales decision is now made and these challenges are getting harder, not easier.
Migration is the other structural variable worth watching closely, because unlike interest rates it feeds housing demand directly rather than through financing costs. Net overseas migration turned negative in 2021 (-56,375) for the only time in this dataset, as international borders closed — and the subsequent reopening drove it to 281,325 in 2022 and a record 530,150 in 2023, before easing to 404,675 in 2024 and 314,000 in 2025 as visa settings tightened. That swing of nearly 590,000 people in underlying annual demand across just two years is a bigger single input to the housing task than any one interest rate cycle, and it lines up closely with the reacceleration of price growth in Brisbane, Adelaide and Perth from 2022 onward.
What this means for our industry
The long-run pattern and the current correction point to different but related implications depending on where you sit in the industry.
● For developers and financiers: the data argues against reading a Sydney or Melbourne correction as a sign to pause pipeline broadly — it is concentrated in exactly the two markets currently seeing the largest rate-driven demand pullback. Feasibility work in Perth, Adelaide and Brisbane should stress-test for continued (if slower) growth, while east-coast projects sitting close to settlement should consider variability of a further 3–8% price movement through the FY27 window on the current forecast range if historical norms repeat, particularly where supply continues to create a shortfall from demand which is still being fuelled by forecast net international growth of circa 260,000 additional persons.
● For town planners and policymakers: the 55-year affordability gap did not open in any single cycle, which argues for supply-side responses measured in years and decades rather than reactions to any one interest rate movement. The migration data is a sharper, faster-moving lever than most zoning or planning timelines can respond to — the 530,150 net arrivals in 2023 alone is roughly equivalent to a new outer-suburban city's worth of housing demand landing in a single year…impossible to plan for or fix in the short term. The Federal government broke the mould, now it continues to interfere through broad based taxation strategies which could contribute to pushing the nation into recession. And whilst I am at it, the increase in company registrations is simply a response out of trusts, not an economic boom time response.
● For sales professionals and agencies: history says corrections in Sydney and Melbourne have historically been shorter and shallower than headlines suggest — only two calendar years since 1970 (2011 and 2019) have seen the eight-city average price fall, and neither by more than about 4%. Client conversations are better anchored to city-specific fundamentals (migration, supply, local employment) than to the national cash rate headline, which explains only part of the current divergence. The reductionist narrative at present is an oversimplification of the many factors currently making supply lead markets a near on impossibility.
● For executives and investors: the two-speed pattern seen in the GFC, the 2022–23 cycle and again now is a recurring feature, not a one-off. Portfolio and expansion decisions that assume all eight capitals move together will misread both the downside in Sydney/Melbourne and the upside still running in the resource and migration-linked States. Labour shortages in South East Queensland will also be further compounded as the preparations for the Olympics gathers momentum.
Outlook
Economists broadly expect the RBA's first rate cut in this cycle around the middle of 2027, meaning the current correction in Sydney and Melbourne likely has further to run before conditions ease. However, The NPR Co suspects that there could be an interest rate reduction in late 2026 if fuel prices and other inflationary related inputs tied to global uncertainty are reigned in. Perth, Adelaide and Brisbane are forecast to continue toward record highs, though at a decelerating pace as affordability limits bite even in the currently stronger markets. The 55-year record suggests the probability of a sustained, broad-based national decline remains low — but the record equally shows that individual capitals can and do diverge sharply for years at a time, and the current cycle is squarely looking down the barrel of one of those periods.
Matthew Gross | Director | mgross@nprco.com.au
Nicholas Price | Associate Director | nprice@nprco.com.au