Capital City Housing : Prices, sales volumes and a 13% downside stress test

Summary
The market has split into two stories: price resilience remains strongest outside Sydney and Melbourne, while transaction volumes have weakened sharply across almost every capital city. The June quarter therefore looks less like a uniform price correction and more like a broad contraction in market liquidity.

ABS June Quarter Housing Data
The June Quarter: Price Softening, Volume Contraction
Across the eight capitals, the June quarter produced a clear weakening in transaction activity. Established-house transfer volumes fell from March to June in every capital, while attached-dwelling volumes also declined in every capital. Price movements were much less uniform: Perth (+0.5%) and Darwin (+0.3%) recorded small house-price increases and Hobart was unchanged, while Sydney (-4.0%) and Canberra (-4.6%) recorded the largest quarterly house-price declines.
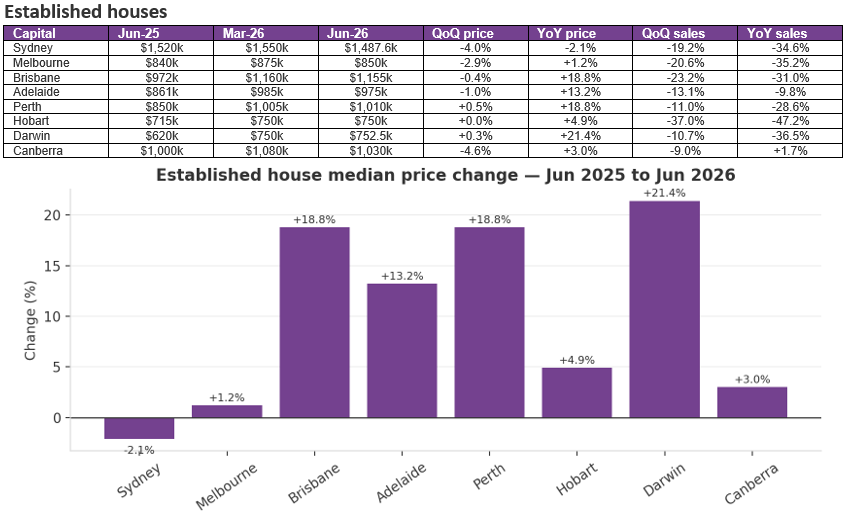
The annual comparison shows the geographic divergence clearly. Darwin (+21.4%), Brisbane (+18.8%), Perth (+18.8%) and Adelaide (+13.2%) remained well above June 2025 house medians. Sydney was 2.1% below June 2025, while Melbourne was only 1.2% above. Yet the quarterly direction turned softer in several markets, most notably Sydney (-4.0%) and Canberra (-4.6%).
Attached Dwellings: Relative Resilience, But Liquidity Is Falling
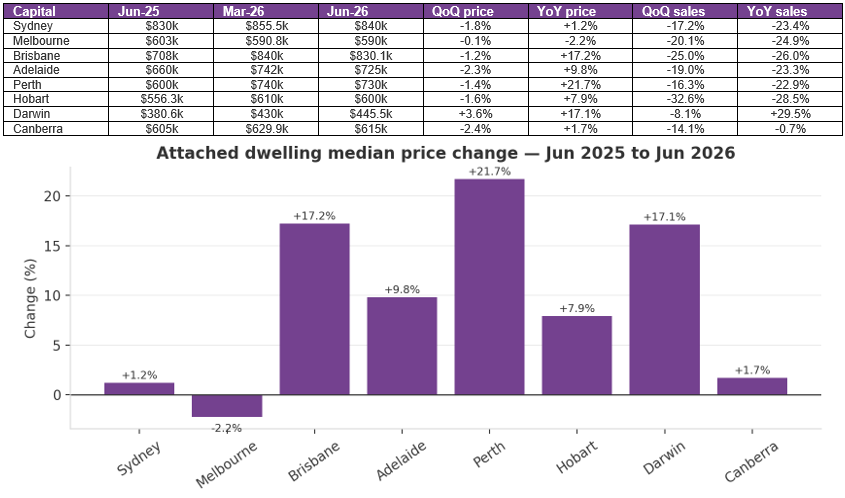
Attached prices were generally less volatile than house prices in the June quarter. Darwin was the only capital to record a material quarterly increase (+3.6%). Sydney, Brisbane, Adelaide, Perth, Hobart and Canberra softened by roughly 1%–2.4%, while Melbourne was effectively flat. On an annual basis, Perth (+21.7%), Brisbane (+17.2%) and Darwin (+17.1%) remained strongest.
The more important signal is turnover. Attached sales volumes fell quarter-on-quarter across all eight capitals. Brisbane (-25.0%), Melbourne (-20.1%), Adelaide (-19.0%) and Sydney (-17.2%) all recorded substantial contractions. This indicates that the market adjustment is occurring first through fewer transactions and reduced liquidity rather than a uniform collapse in median values.
What the Volume Data is Saying
Price is only one half of the market. Sales volume measures the depth at which buyers and sellers are actually agreeing or willing to sell or buy. The June data shows a broad reduction in that depth that aligns with reductions in lending activity.

Three implications
• Liquidity has weakened before values have fully adjusted. A large fall in transaction numbers can occur while medians remain relatively firm because fewer owners are willing or required to transact at lower prices.
• The strongest annual price markets are not immune to the turnover slowdown. Brisbane and Perth retained very strong year-on-year price growth, yet house sales volumes were down 31.0% and 28.6% respectively from June 2025 despite strong population growth.
• The May budget announcement which was largely considered hostile to property owners, combined with geopolitical events and uncertainty around inflation and interest rates has removed any urgency from the market. This will have significant implications for State government revenues as well as neighbourhood real estate agencies to the construction sector.
If Values Fell 13% From the Recent Cycle Peak: What Would Be Lost?
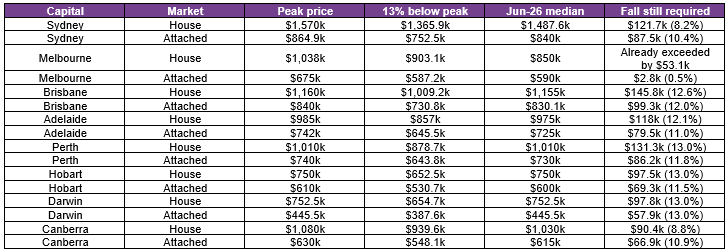
A 13% fall is used as a stress scenario for capital-city markets that remain at or close to their recent cycle peak; it is not an NPR Co forecast. Melbourne is treated differently for detached housing because in particular as both established house and attached dwelling medians have already undergone a material peak to current correction. For Melbourne, the tables therefore report the actual decline from the December 2021 cycle peak to the June 2026 median rather than imposing a hypothetical 13% fall.

Remaining Fall to the 13% Peak Threshold
This comparison shows the peak median, the value represented by a 13% decline from that peak, the June 2026 median, and the additional fall required from the June 2026 median to reach the 13% threshold. Melbourne houses are shown as having already exceeded the threshold.
Market Interpretation: A Correction Is Not One National Market
The June-quarter evidence does not support treating Australia's capitals as a single market. Sydney and Melbourne entered the quarter with weaker price momentum, while Brisbane, Adelaide, Perth and Darwin still retained large year-on-year gains. At the same time, transaction volumes contracted broadly across the country.
What matters from here
Interest rates and borrowing capacity: Higher borrowing costs reduce the amount households can bid and can increase the gap between vendor expectations and purchaser capacity. The cycle was already slowing in some markets before the May budget, this simply acted as an accelerant.
Forced versus discretionary selling: A low-volume correction can remain orderly while owners can defer selling. A larger price correction becomes more plausible if financial pressure materially increases the number of sellers who must transact because they can no longer service their debt, have limited or no equity and the bank can’t see a work out scenario.
Listings and market depth: The balance between new listings and active buyer demand will determine whether weaker turnover remains a liquidity event or becomes a larger repricing event.
Relative affordability: Attached dwellings and lower-priced capitals may retain greater buyer depth where detached-house affordability has become stretched.
Supply constraints: Persistent construction costs and constrained new supply can provide a medium-term floor under established housing even while cyclical demand weakens.
Nationally, the ABS reported that the total value of Australia's dwelling stock fell 0.3% in the June quarter 2026 and the mean dwelling price fell 0.7%, the first quarterly fall in total dwelling value since September 2022. This provides broader confirmation that the market moved into a softer phase during the quarter.
The June quarter is best characterised as a contraction in market liquidity accompanied by selective price correction.
Quarter-on-quarter sales volumes fell across all eight capitals for both established houses and attached dwellings, while price performance remained geographically divergent. Sydney's median house and Melbourne's median attached were below June 2025 levels; Brisbane, Adelaide, Perth and Darwin remained materially above June 2025 price levels in both dwelling categories. Year-on-year turnover was not uniformly lower: Canberra house transfers rose 1.7% and Darwin attached transfers rose 29.5%.
The comparison demonstrates why a uniform national percentage headline can obscure the position of individual markets. Melbourne has already experienced the correction being contemplated elsewhere: established houses are 18.1% below their December 2021 peak and attached dwellings are 12.6% below their December 2021 peak. The other capital-city rows remain stress scenarios rather than forecasts, allowing the hypothetical downside to be compared with Melbourne's observed peak-to-current adjustment.
The key question is therefore not simply whether prices can fall by 13%. It is whether the weakening in transaction activity develops into sufficient selling pressure to force that repricing. The June-quarter data demonstrates that buyer/seller agreement has already become materially harder to achieve. The next phase will be determined by interest rates, household serviceability, listings, forced selling and the capacity of supply constraints to offset weaker demand.
Matthew Gross | Director | mgross@nprco.com.au
Nicholas Price | Associate Director | nprice@nprco.com.au